Note: This post is by your favorite programmer, Joraaver!
Hey guys. Sorry for the long wait. My first project in my Operating Systems class took an insane amount of time. But enough about me. Time to dissect the game (WARNING: LONG and MEATY)!
I'll break this post up into 4 parts (NOT 4 posts, 4 parts): setup, analysis, solution, and remarks. Please keep in mind that I strive to explain everything to my best understanding, but I'm a beginner game developer, a student, and above all, nowhere near perfect. If I did something wrong or could have done something better, PLEASE tell me!
The Setup
It was around 11:50 pm Saturday night, January 4th, when a play-tester called me to report an error. After the 16th level and the 20th level, he would get a java.lang.OutOfMemoryError: Direct buffer memory error. So, as any developer would, I collected the details of his machine--graphics card, RAM, operating system, the works. However, the machine wasn't anything special, so I will leave those details out. The main part occurs now: I have a bug, it's 12:10 am Sunday morning, and I want to release around 10:00 am Sunday morning. What do I do?
The Analysis
First, I needed some way of reproducing this error. No matter what, in jME, I couldn't recreate the error. I decided to build and play the game. No luck there either. Only when I played the test version we hosted for our play-testers did I get the error. This led me to suspect that the error had to have something to do with the difference in environments, perhaps the difference in the way memory was handled in the built version than the compiled version in NetBeans. After doing a little digging, a suggestion came by to run a scanner on the memory to see if memory leaks were occurring. It figures that in a language that's supposed to take care of memory so the developer doesn't have to, the game-breaking bug that occurs hours before release may involve just that.
Moving forward, I decided to start the game with the NetBeans Profiler. jME is built as a wrapper around NetBeans, so the NetBeans Profiler comes with it. I followed tutorial from NetBeans, found HERE to start the debugging.
After reading the tutorial, I first needed to see if some object's Surviving Generations was continuously increasing. If so, then I had a memory leak. It was time to fire up the profiler and get going.
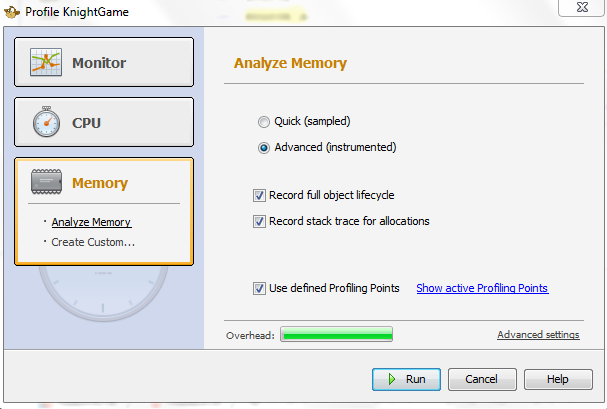 The settings I used to start the profiling.
After one run, I only got 3-4 Surviving Generations. This didn't seem like too much. After another run, the number rose to 5 Surviving Generations. It was increasing, I wasn't sure why, and I wasn't sure if I should take it seriously or not, since the generations were so small. Even when I sorted the objects by Surviving Generations, as suggested by the tutorial, there were no glaring issues. Yes, the general Surviving Generations increased, but not due to anything I was allocating. Nonetheless, I started by removing my obsolete collections first. I had a bunch of Vectors that are obsolete collections in Java. Changing them to ArrayLists was pretty easy (in fact, all I had to do was change the name). I restarted the profiler, and the Surviving Generations increase still existed, but it was extremely slow. In fact, after running through the game 5 times, the Surviving Generations increased maybe one or so each time, but the funny thing was that the telemetry (pictured below) showed it never spent any time in garbage collection (GC). I could only assume that with only 5 Surviving Generations, the GC didn't even think it needed to do its job yet. This obviously wasn't my problem then, but this also left me stumped. Regardless, it was only 2:00 am, and I hadn't given up yet.
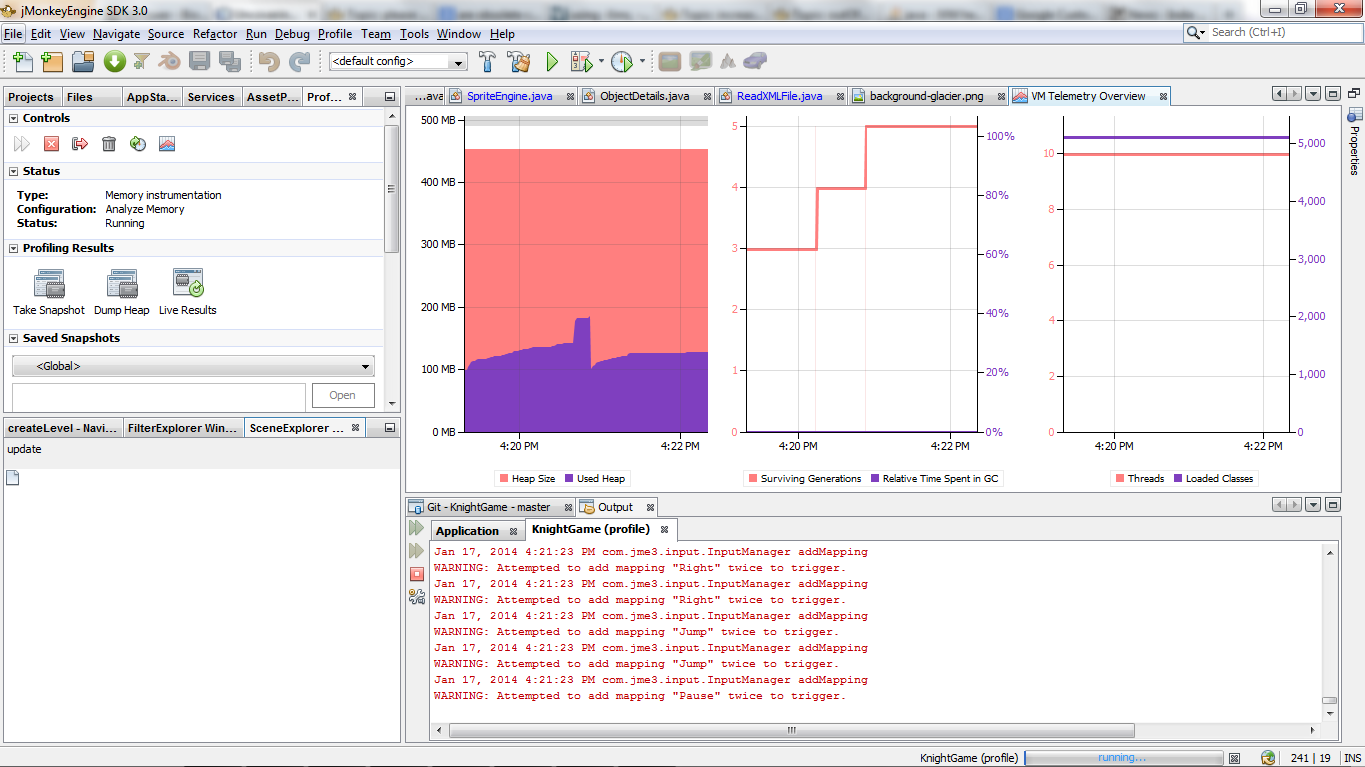 Telemetry of the profiler. From left to right: heap size analysis, GC analysis, and thread analysis.
After some searching, I realized that perhaps a memory leak wasn't the issue at all. Some jME specific forums popped up after entering a more 'jME' specific search (I don't know why I hadn't thought of this earlier). There were some terms being thrown around regarding the default heap size of the VM. So far in my career, the heap has been a more abstract, "out of the scope of this class" sort of concept, so I wasn't sure if I'd understand what I was about to fix. I'm still not sure, but I am about to do the best I can to explain.
According to the link on JVM Tuning there are three parameters I wanted to look at: Xms, Xmx, and Xmn.
There are 2 garbage collection threads that run with a Java application: a lightweight one and a heavyweight one. The lightweight one takes care of the Eden generations, and the heavy one takes care of the rest.
The general consensus on multiple jME threads was not that there was a memory leak, but rather, there was simply not enough memory to allocate for the next item trying to be created. Otherwise, the issue could be that the heavy garbage collecting thread wasn't running fast enough to clear up memory before I needed more.
Taking a small step back, I realized that on the shift from the 16th level to the 17th and from the 20th level to a cut-scene, a new background is loaded. When I looked at the resolution of these pictures, I realized they were 3000x2048 px. That's a somewhat large file to load on the spot. So large, in fact, that after all the other files are done loading to this point, there is no longer any space to load the background. All speculation, of course, but in hindsight, I think this was the issue.
The Solution
Luckily, it seemed like it was a simple fix. The prescription noted by many threads indicated that I should merely fiddle around with Xms and Xmx until the unwanted behavior goes away. I also came across a suggestion to alter the MaxDirectBufferMemory size as well for direct buffer memory, so I did this as well. In order to do all this memory options fiddling, I went into the build settings of the game and adjusted the VM parameters.
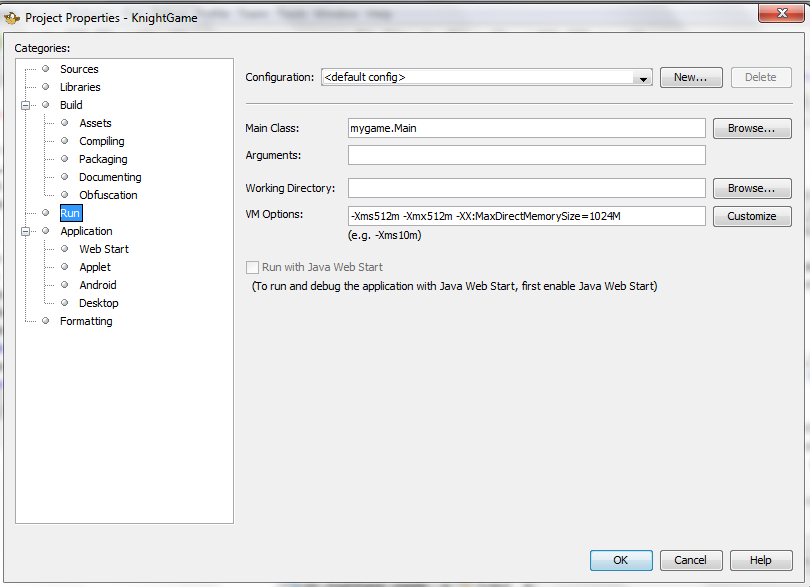 VM Options Xms, Xmx, and XX:MaxDirectMemorySize set. I do not know if these are optimal values of even necessary values. All I know are that these are the values that worked. Educate me if necessary in the comments!
I ran it just to make sure I didn't break something, and what do you know, it worked! I sent it to the play-tester (at around 3:00 am in the morning; you can tell we have great play-testers! I had him delete any saved memory of the game and start fresh. This time, he didn't get the error! Perfect! With that, I built it, hosted it on the respective release sites, and went to sleep at a sound 3:30 am.
Remarks
All in all, it was definitely an exciting (albeit extremely annoying) adventure. Looking back, I learned about:
- Java VM parameters and how GC works in Java.
- NetBeans profiler and how to debug memory leaks in Java, something they still haven't taught us fully yet for C in my CS classes here at UCLA.
- What it really means to have a game-breaking bug (or any kind of bug for a product) hours before a huge deadline (in our case, release).
- How important it is to have testers. Without the play-tester who reported this error, I would have never seen it, and our team would now be in a large mess. Press would have been bad, and our future as an indie gamedev team would have been dashed. Of course, failure can help set you up for success, but feeling failure breathing down your neck is even better.
- I may try pre-loading all my assets for our next game. This bug may have occurred because I didn't optimize my asset loading, and decided to load the background every time a entered a new level (not even a new background!). Had I loaded the 5 backgrounds once in the beginning, and merely referenced them when needed, this issue could have been avoided entirely. It is, after all, only a 2D game. How much memory could I have needed?
To add to (4), an extremely small portion of people still report this error. I'm not sure why, but my only guess is that I need to up the max heap size even more. Again, more playtesters may have helped me catch the problem. I'll see what works, but if anyone can shed some light on this issue, that would be great!
I hope you all enjoyed reading my thoughts on how I fixed our game-breaking bug (I love that term, especially after watching Indie Game: THE MOVIE).
If you have comments, questions, concerns, criticisms, or just want to talk, post below or shoot us an email at indiebynight at elrel dot com .